Thank you all for your answers. Will test this.
M
Offline
Posts
-
RE: File import and doc merge -> InsertAfter or c4d.PREF_INTERFACE_I_BOTTOM
-
File import and doc merge -> InsertAfter or c4d.PREF_INTERFACE_I_BOTTOM
Dear Team,
I am trying to import files and place them in the object tree in the right order,i tried to set the preferences with
c4d.PREF_INTERFACE_I_BOTTOMbefore import but it did not change my order.interface_preferences = c4d.GetWorldContainer() previous_insert_at = interface_preferences.GetInt32(c4d.PREF_INTERFACE_INSERTAT) interface_preferences.SetInt32(c4d.PREF_INTERFACE_INSERTAT, c4d.PREF_INTERFACE_I_BOTTOM, )Is there a convenient way or do i need to move the "node" manually to the bottom on each import ...
or more universal for me is there a way to sort root nodes in the Object manager tree ? (only found an old coffee thread ... )
thanks in advance ...
mogh -
RE: TreeView DropDown Menu
I am addiong to this thread hence it is related ... feel free to fork
I am trying to only display a dropdown on certain rows ... is that possible ....?
Here is a minimal dummy plugin where I only want to show the dropdown on "stp" files ....
even though the dropdown gets no content it is still displayed ....thank you
import c4d PLUGIN_ID = 12345678 PLUGIN_NAME = "ListView Dropdown Prototype" ID_TREE_VIEW = 1000 ID_FILE_NAME = 1001 ID_IMPORT_OPTION = 1002 ID_IMPORT_OPTION_DEFAULT = 1100 ID_IMPORT_OPTION_HIGH = 1101 ID_IMPORT_OPTION_MEDIUM = 1102 ID_IMPORT_OPTION_LOW = 1103 dummyfile_list = ["hud.stp", "material_reference.wrl", "front_axle.stp", "body.wrl", "wheel_variant.stp"] class DummyFile: def __init__(self, file_name, import_option="Default"): self.file_name = file_name self.import_option = import_option class DummyFileListView(c4d.gui.TreeViewFunctions): def __init__(self, dialog): self.dialog = dialog self.files = [DummyFile(file_name) for file_name in dummyfile_list] def GetFirst(self, root, userdata): return self.files[0] if self.files else None def GetNext(self, root, userdata, dummy_file): current_index = self.files.index(dummy_file) next_index = current_index + 1 return self.files[next_index] if next_index < len(self.files) else None def GetDown(self, root, userdata, dummy_file): return None def GetId(self, root, userdata, dummy_file): return id(dummy_file) def GetName(self, root, userdata, dummy_file): return dummy_file.file_name def IsSelected(self, root, userdata, dummy_file): return False def GetColumnWidth(self, root, userdata, dummy_file, column_id, area): if column_id == ID_FILE_NAME: return area.DrawGetTextWidth(dummy_file.file_name) + 24 if column_id == ID_IMPORT_OPTION: return 120 return 96 def GetDropDownMenu(self, root, userdata, dummy_file, column_id, menu_info): if column_id != ID_IMPORT_OPTION: return # this is logical but does not do the trick .... if not dummy_file.file_name.lower().endswith(".stp"): return options = { ID_IMPORT_OPTION_DEFAULT: "Default", ID_IMPORT_OPTION_HIGH: "High", ID_IMPORT_OPTION_MEDIUM: "Medium", ID_IMPORT_OPTION_LOW: "Low", } for option_id, label in options.items(): menu_info["menu"].SetString(option_id, label) menu_info["entry"] = next( option_id for option_id, label in options.items() if label == dummy_file.import_option ) def SetDropDownMenu(self, root, userdata, dummy_file, column_id, entry): if column_id != ID_IMPORT_OPTION: return #this is logical but does not do the trick .... if not dummy_file.file_name.lower().endswith(".stp"): return options = { ID_IMPORT_OPTION_DEFAULT: "Default", ID_IMPORT_OPTION_HIGH: "High", ID_IMPORT_OPTION_MEDIUM: "Medium", ID_IMPORT_OPTION_LOW: "Low", } dummy_file.import_option = options.get(entry, dummy_file.import_option) self.dialog.tree_view.Refresh() class ListViewDropdownDialog(c4d.gui.GeDialog): def __init__(self): self.tree_view = None self.file_list_view = DummyFileListView(self) def CreateLayout(self): self.SetTitle(PLUGIN_NAME) tree_view_settings = c4d.BaseContainer() tree_view_settings.SetBool(c4d.TREEVIEW_BORDER, c4d.BORDER_THIN_IN) tree_view_settings.SetBool(c4d.TREEVIEW_HAS_HEADER, True) tree_view_settings.SetBool(c4d.TREEVIEW_HIDE_LINES, True) tree_view_settings.SetBool(c4d.TREEVIEW_RESIZE_HEADER, True) tree_view_settings.SetBool(c4d.TREEVIEW_FIXED_LAYOUT, True) tree_view_settings.SetBool(c4d.TREEVIEW_ALTERNATE_BG, True) if c4d.GetC4DVersion() >= 24000: tree_view_settings.SetInt32(c4d.TREEVIEW_VERTICAL_SPACE, 4) self.tree_view = self.AddCustomGui(ID_TREE_VIEW, c4d.CUSTOMGUI_TREEVIEW, "", c4d.BFH_SCALEFIT | c4d.BFV_SCALEFIT, 500, 220, tree_view_settings, ) if not self.tree_view: return False layout = c4d.BaseContainer() layout.SetLong(ID_FILE_NAME, c4d.LV_TREE) layout.SetLong(ID_IMPORT_OPTION, c4d.LV_DROPDOWN) self.tree_view.SetLayout(2, layout) self.tree_view.SetHeaderText(ID_FILE_NAME, "Dummy file") self.tree_view.SetHeaderText(ID_IMPORT_OPTION, "STP import option") self.tree_view.SetRoot(self.tree_view, self.file_list_view, None) return True def InitValues(self): self.tree_view.Refresh() return True class ListViewDropdownCommand(c4d.plugins.CommandData): def __init__(self): self.dialog = ListViewDropdownDialog() def Execute(self, document): return self.dialog.Open( c4d.DLG_TYPE_ASYNC, PLUGIN_ID, defaultw=520, defaulth=280, ) if __name__ == "__main__": c4d.plugins.RegisterCommandPlugin( id=PLUGIN_ID, str=PLUGIN_NAME, info=0, icon=None, help="TreeView dropdown.", dat=ListViewDropdownCommand(), ) -
RE: Change render Space (Color Profile) - how?
Ok i did not grasp that a node can also be an object ... thought about it as "texture node" ...
There was no question ...I got
doc[c4d.DOCUMENT_COLOR_MANAGEMENT] = c4d.DOCUMENT_COLOR_MANAGEMENT_BASICto work but only after the document (new or freshly loaded) was rendered once .... did I find a bug or do i have to "save" the render / color settings after setting up ....
I tried to insert an
c4d.EventAdd()here and there but nothing helped ...executing / rendering a second time is totally fine ... !
        def colorspace(self, doc, rd, revert=False):
        #### Convert Color Space
        # 0 = c4d.DOCUMENT_COLOR_MANAGEMENT_BASIC = Legacy sRGB Linear
        # 1 = ACEScg
        # ['ACES2065-1', 'ACEScg', 'scene-linear DCI-P3 D65', 'scene-linear Rec.709-sRGB', 'scene-linear Rec.2020']

        # ATM this does not convert anything it just sets the C4D DOCUMENT_COLOR_MANAGEMENT to the legacy mode and back

        if self.IsForceLinear is True:
            rd[c4d.RDATA_IMAGECOLORPROFILE] = c4d.bitmaps.ColorProfile.GetDefaultLinearRGB()
            rd[c4d.RDATA_FORMATDEPTH] = 2 # 0=8Bit 1=16Bit 2=32bit
        else:
            rd[c4d.RDATA_IMAGECOLORPROFILE] = c4d.bitmaps.ColorProfile.GetDefaultSRGB()
            rd[c4d.RDATA_FORMATDEPTH] = 0

        print("Image:", rd[c4d.RDATA_IMAGECOLORPROFILE])

        ### Set Render Color Bit to 32 Bit
        doc[c4d.DOCUMENT_COLORPROFILE] = 1 # 0 sRGB 1 Linear 2 deactivated

        if c4d.GetC4DVersion() >= 250020:
            if revert==True:
                print("Revert Color Space triggered")

                doc[c4d.DOCUMENT_COLOR_MANAGEMENT] = 1 # 1 = ACEScg
                pass

            else:
                print("Convert Color Space triggered")
                if doc[c4d.DOCUMENT_COLOR_MANAGEMENT] == c4d.DOCUMENT_COLOR_MANAGEMENT_BASIC:
                    print("The document is already in basic mode.")
                else:
                    print("Current Render Color Space: ",doc.GetOcioRenderingColorSpaceNames()[doc[c4d.DOCUMENT_COLOR_MANAGEMENT]])
                    doc[c4d.DOCUMENT_COLOR_MANAGEMENT] = c4d.DOCUMENT_COLOR_MANAGEMENT_BASIC

                if doc[c4d.DOCUMENT_COLOR_MANAGEMENT] == c4d.DOCUMENT_COLOR_MANAGEMENT_BASIC:
                    print("-> Set to Basic Mode")

                doc.ExecutePasses(
                    bt=None,
                    animation=False,
                    expressions=True,
                    caches=True,
                    flags=c4d.BUILDFLAGS_NONE
                )

        c4d.EventAdd()
thank you for your time and patience ...
-
RE: Change render Space (Color Profile) - how?
ok, no node here ...
Objectcolor [c4d.ID_BASEOBJECT_COLOR] Vector(0.001, 0, 0.021) -> rendering pixelcolor should be Vector(0.001, 0, 0.021)Somewhere my colors are "transformed" I have to systematically rebuild it to find the "conversions" .... and how to prevent them ...
-
RE: Change render Space (Color Profile) - how?
Thank you,
I guess i have to rewrite the color creation and profile settings of my plugin ... too many "this seemed to work sometime" code bits

-
RE: Change render Space (Color Profile) - how?
Hi Ferdinand
Thank you for your Answer,I am trying to implement this, ... atm a lot of uncertain stuff at my end .... quick follow up question
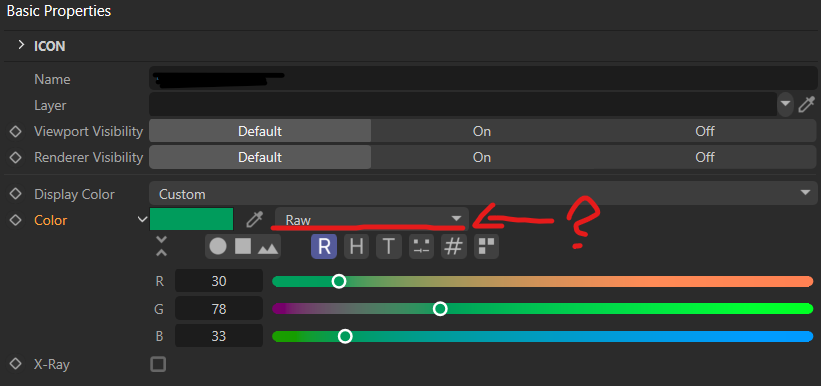
How do i set the Color Profile of an object Color ? ( dragging object color to console only gives the vector )
Thank you
-
Change render Space (Color Profile) - how?
Dear Dev Team,
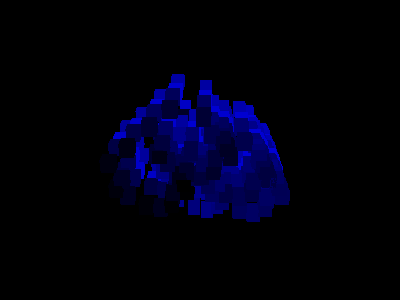
I have a plugin that renders (Standard C4d Renderer - fastest for plain color at the time) a flat color rendering (no dithering, shading, or lights) of object display color (yes plain object color, no textures). Input and output have to be the exact same color, to evaluate if the camera "sees" an object. This plugin worked before 2025.2 with "sRGB linear" workflow.
Render output looks like this (the more objects the more colors of course):
Quick solution for me is to change the "Render space" to legacy "sRGB linear workflow"
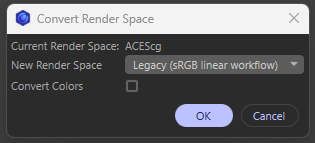
Question: -> how would I do that in python ? (and back to the users render Color-space so it does not mess up the users settings)Is there a better way to get Input object color and rendered color to be exactly the same with no color space change? A color transform on the bmp? how would I do that?
thank you for your time
-
RE: Adding an Icon to a GeDialog Menu Group
Yes I wanted submenu with Icon, thanks for Up to Date clarification.
-
RE: Adding an Icon to a GeDialog Menu Group
Any updates on this ?
if yes would be nice to incorporate this into your nice "menue example":
https://developers.maxon.net/forum/topic/14276/building-menus-with-c4dpl_buildmenu-in-s26/3?_=1785138165926 -
RE: How to measure Viewport performance? -> Troubleshooting and optimization.
Hi ferdinand,
Thank you for your time please do not prioritize this conversation, I feel bad for hijacking your time.Heavy Scene from above disable all drawing operations (Anim Without View, No Ui Update) looks fine i guess Total rendering time: 648.58 ms Single-threaded rendering time: 566.39 ms Single-threaded finalizer time: 0.00 ms Multithreaded rendering time: 82.19 ms Multithreaded rendering 12.673 % Kernel execution time: 82.19 ms Worker idle time: 0.00 ms Worker sleep time: 0.00 ms Threading efficiency 100.000 % Expected scaling would be about 3.611 xI am expressing myself not precise enough.
its not about the raw FPS I am worried about, 11 FPS on our vehicles is fine I guess. what keeps me up at night is these recurring stutters when moving the camera through the scene (no animation just looking at stuff)
and things like the time to see a simple cube in a empty scene - it always feels laggy or you could say delayed
or how the Live selection circle lags behind the mouse pointer (empty scene)oversimplified example:
Heavy scene FPS graph ( 0, 0, 0, 11, 11, 11, 11, 0, 0, 11, 11, 11, 11, 0, 0, 11, 11 )
Cube creation FPS graph ( 0, 0, 0, 60, 60, 60, 60, ... )Plugin related this is more or less what started this hunt .... :
I can interact with my Draw line Plugin (that is not the state of the plugin its evolved now but to give a exaple) on my:- laptop with ~60 FPS (Quadro 2000)
- on my private PC with R20 with ~200+ FPS (RTX 4080)
- on my workstation with ~8 FPS (RTX 3090)
yes crawlingly slow
the plugin performance depends on Viewport size and point number but the difference repeatable between these "test" machines.
(Cinebench 2024.1 - GPU Test 3090 ~ 17000 points 25Minutes continuous) Feels fine
cheers
-
RE: How to measure Viewport performance? -> Troubleshooting and optimization.
Thanks Ferdinand,
the Summary only pops on "Anim Test"
Empty Scene:
my old laptop has as a live readout (~ 5ms, at 60 FPS )
my Workstation has as a live readout (~ 33ms 52 FPS )compared to yours, mine seems off - while this will not help me immediate it keeps me sane ( I was starting to doubt myself if I really have a lag or problem ...)
thank you
Live readout 17ms, 59 FPS
Workstation: RTX 3090, i9-10980XE
empty scene
 ============================ General =================================

Performance cores:  36
Virtual cores:  18
Efficiency cores:  0
Threads used for the queue:  36

Total rendering time:  1744.82 ms
Single-threaded rendering time:  1711.42 ms
Single-threaded finalizer time:  0.00 ms
Multithreaded rendering time:  33.40 ms
Multithreaded rendering 1.914 %
Kernel execution time: 31.02 ms
Worker idle time: 0.00 ms
Worker sleep time: 0.00 ms
Threading efficiency 92.887 %
Expected scaling would be about 1.365 x

Total rendering time equals single-threaded rendering time plus finalizer time plus multithreaded rendering time.
Threading efficiency is the percentage of multithreaded rendering time during which kernel code is executed
The expected scaling is calculated based on the number of physical performance, efficiency and virtual cores.
This how the scaling should be given the percentage of single-threaded code and the efficiency of the threading.
If your actual scaling is far lower than the expected scaling your code does not scale properly: It might
contain atomics, mutexes or any other form of synchronisation or is memory-bound and/or out of CPU caches.
No lost events during profiling.

============================ By Scope =================================

 total 1.07 ms
ViewScheduler total 1411.58 ms Threaded 33.40 ms avg 31.02 ms min 31.02 ms max 31.02 ms [latency avg 0.00 us min 0.00 us max 0.00 us]

============================ Detailed in Order of Execution =================================

86.7 us: 	 total 1.07 ms self 1.07 ms
1.2 ms: 	ViewScheduler total 62.02 ms self 61.56 ms
2.7 ms: 		JobGroup total 0.46 ms self 0.03 ms avg 0.43 ms min 0.43 ms max 0.43 ms [latency avg 0.00 us min 0.00 us max 0.00 us]
... truncated
Live readout 97ms, 11 FPS Workstation: RTX 3090, i9-10980XE vehicle with 10.000 objects 119mio polys ~ 10% displayed ============================ General ================================= Performance cores: 36 Virtual cores: 18 Efficiency cores: 0 Threads used for the queue: 36 Total rendering time: 7433.32 ms Single-threaded rendering time: 5642.04 ms Single-threaded finalizer time: 0.00 ms Multithreaded rendering time: 1791.29 ms Multithreaded rendering 24.098 % Kernel execution time: 1788.86 ms Worker idle time: 0.00 ms Worker sleep time: 0.00 ms Threading efficiency 99.864 % Expected scaling would be about 5.957 x Total rendering time equals single-threaded rendering time plus finalizer time plus multithreaded rendering time. Threading efficiency is the percentage of multithreaded rendering time during which kernel code is executed The expected scaling is calculated based on the number of physical performance, efficiency and virtual cores. This how the scaling should be given the percentage of single-threaded code and the efficiency of the threading. If your actual scaling is far lower than the expected scaling your code does not scale properly: It might contain atomics, mutexes or any other form of synchronisation or is memory-bound and/or out of CPU caches. No lost events during profiling. ============================ By Scope ================================= total 6.35 ms ViewScheduler total 7001.25 ms Threaded 1791.29 ms avg 1788.86 ms min 1788.86 ms max 1788.86 ms [latency avg 0.00 us min 0.00 us max 0.00 us] ============================ Detailed in Order of Execution ================================= 63.5 us: total 6.35 ms self 6.35 ms 6.4 ms: ViewScheduler total 99.50 ms self 76.23 ms 10.6 ms: JobGroup total 0.08 ms self 0.00 ms avg 0.08 ms min 0.08 ms max 0.08 ms [latency avg 0.00 us min 0.00 us max 0.00 us] 10.7 ms: JobGroup total 0.17 ms self 0.00 ms avg 0.17 ms min 0.17 ms max 0.17 ms [latency avg 0.00 us min 0.00 us max 0.00 us] 11.0 ms: JobGroup total 0.04 ms self 0.00 ms avg 0.04 ms min 0.04 ms max 0.04 ms [latency avg 0.00 us min 0.00 us max 0.00 us] 11.0 ms: JobGroup total 0.35 ms self 0.00 ms avg 0.35 ms min 0.35 ms max 0.35 ms [latency avg 0.00 us min 0.00 us max 0.00 us] 11.4 ms: JobGroup total 0.13 ms self 0.00 ms avg 0.13 ms min 0.13 ms max 0.13 ms [latency avg 0.00 us min 0.00 us max 0.00 us] 11.6 ms: JobGroup total 0.37 ms self 0.00 ms avg 0.37 ms min 0.37 ms max 0.37 ms [latency avg 0.00 us min 0.00 us max 0.00 us] 12.0 ms: JobGroup total 0.14 ms self 0.00 ms avg 0.14 ms min 0.14 ms max 0.14 ms [latency avg 0.00 us min 0.00 us max 0.00 us] 48.1 ms: JobGroup total 21.98 ms self 0.03 ms avg 21.95 ms min 21.95 ms max 21.95 ms [latency avg 0.00 us min 0.00 us max 0.00 us] 112.9 ms: ViewScheduler total 138.31 ms self 116.85 ms truncatedheavy scene camera orbit animation ============================ General ================================= Performance cores: 36 Virtual cores: 18 Efficiency cores: 0 Threads used for the queue: 36 Total rendering time: 9071.78 ms Single-threaded rendering time: 7352.54 ms Single-threaded finalizer time: 0.00 ms Multithreaded rendering time: 1719.24 ms Multithreaded rendering 18.952 % Kernel execution time: 1698.41 ms Worker idle time: 0.49 ms Worker sleep time: 0.00 ms Threading efficiency 98.788 % Expected scaling would be about 4.854 x Total rendering time equals single-threaded rendering time plus finalizer time plus multithreaded rendering time. Threading efficiency is the percentage of multithreaded rendering time during which kernel code is executed The expected scaling is calculated based on the number of physical performance, efficiency and virtual cores. This how the scaling should be given the percentage of single-threaded code and the efficiency of the threading. If your actual scaling is far lower than the expected scaling your code does not scale properly: It might contain atomics, mutexes or any other form of synchronisation or is memory-bound and/or out of CPU caches. No lost events during profiling. ============================ By Scope ================================= total 5.63 ms ViewScheduler total 8711.70 ms Threaded 1719.24 ms avg 1698.41 ms min 1693.29 ms max 1703.53 ms [latency avg 11857.61 us min 11857.61 us max 11857.61 us] [sleep 0.00 us idle 493.53 us] ============================ Detailed in Order of Execution ================================= 61.5 us: total 5.63 ms self 5.63 ms 5.7 ms: ViewScheduler total 129.34 ms self 108.51 ms 9.5 ms: JobGroup total 0.07 ms self 0.00 ms avg 0.07 ms min 0.07 ms max 0.07 ms [latency avg 0.00 us min 0.00 us max 0.00 us] 9.6 ms: JobGroup total 0.19 ms self 0.00 ms avg 0.19 ms min 0.19 ms max 0.19 ms [latency avg 0.00 us min 0.00 us max 0.00 us] 9.8 ms: JobGroup total 0.03 ms self 0.00 ms avg 0.03 ms min 0.03 ms max 0.03 ms [latency avg 0.00 us min 0.00 us max 0.00 us] 9.9 ms: JobGroup total 0.34 ms self 0.00 ms avg 0.34 ms min 0.34 ms max 0.34 ms [latency avg 0.00 us min 0.00 us max 0.00 us] 10.3 ms: JobGroup total 0.10 ms self 0.00 ms avg 0.10 ms min 0.10 ms max 0.10 ms [latency avg 0.00 us min 0.00 us max 0.00 us] 10.4 ms: JobGroup total 0.08 ms self 0.00 ms avg 0.08 ms min 0.08 ms max 0.08 ms [latency avg 0.00 us min 0.00 us max 0.00 us] 10.6 ms: JobGroup total 0.07 ms self 0.00 ms avg 0.07 ms min 0.07 ms max 0.07 ms [latency avg 0.00 us min 0.00 us max 0.00 us] 42.9 ms: JobGroup total 19.49 ms self 0.03 ms avg 19.47 ms min 19.47 ms max 19.47 ms [latency avg 0.00 us min 0.00 us max 0.00 us]``` -
RE: How to measure Viewport performance? -> Troubleshooting and optimization.
Thank you ferdinand.
I did not know about the "new" FPS helper, -> there is a checkbox "Save Profile Summary" -> where is that stored and how can I review it ?What do all the options do exactly, is there a short explanation somewhere ? I could not find anything in the C4D Help.
thanks
-
How to measure Viewport performance? -> Troubleshooting and optimization.
Dear community,
It would be really nice if there was a SDK way to measure viewport performance. ( I guess profiling wont suffice) - Something like a plugin to measure viewport performance or something that logs frames, frames consistency, from the C4D internals.
C++ plugins are out of my expertise, and I suspect an "external" plugin wont have the access to all the measurements needed.For plugin developers this could be useful I guess.
Where is the question ? I don't know this is probably a desperate cry for help.
Reason: I am having lag and freezes (empty scene) since S26 onwards (vague guess) and I can not get rid of them, even after several support sessions with Maxon and internal IT.
Thank you for your condolence.
mogh -
RE: Usage of SplineHelp.InitSplineWith() regarding flags -> returned data
Hey ferdinand,
I mixed different questions - I'll keep to the theoretical part to keep the Post relevant to the original question.
I appreciate the informative post as always.

Parametric concept of a spline is clear to me -> that's why i asked about "C4D can not get more precise than a 0° degree line object ?" which was formulated to lose as 0° is mathematical problematic? and I know 0.1 would be better. sorry about that.
The tip about spline 'Adaptive' setting was a good hint, I never use it in work so I forgot about it.So to summarize regarding my question.
The Line object always samples what the user has set in the spline settings and not by a unknown internal setting (for example to give good viewport performance, or nice equal sections)
And its a better fit for my application, hence there is no "linear transport" shenanigans going on.
And if I want to display a high resolution of my calculation, I make an internal copy of that spline and edit the spline settings, instead of sampling a low division spline with spline helper.Normalization / Jagged lines:
I use Menger-Krümmung. -> will open a new topic.
Your code might come in handy when I'll extend the plugin to polygon meshes.
...
...
...Remark
as humans cannot see that level of detail.
I have to disagree on this topic. As a tell tale we import CAD data here into C4D to evaluate the work of the engineers.
Not long ago I said to our surface engineer. "take a look at the end of that surface something feels off, it looks like the surface is lifting" -> The engineer reportet back "you just spoted a 0.001mm surface deviation of an unconstrained spline ending I did not set."
We could argue that the seen result was in fact not 0.001mm but perhaps to surface setup more than 1mm, (or by some rounding error C4D normal tag shading where continuous and then stagnant for 1 pixel) but my point is settings in precision are important and carry through till the final product. Even though a setting of 0.1° for a spline might might be unsuitable in most cases (rendering, performance, ...) it is not for evaluation.
So even C4D and all that rounding / conversion / floating point precision might look like unrealiable, unecessary or even esotheric it caries through to a certain degree and its more reliable than you think.
(Yes we evaluate in the original CAD Program, but the tale is that I saw something even after importing it into C4D)
As reference to why I need this:
Blender Plugin: Surface Diagnostics - Josef Ludvík Böhm
Thank You
-
RE: Usage of SplineHelp.InitSplineWith() regarding flags -> returned data
Thank you ferdinand,
I will implement my own "tagent" / "colinear" ending then, and not use this flag.
@ferdinand said in Usage of SplineHelp.InitSplineWith() regarding flags -> returned data:
As a warning: All the spline helpers implement parallel transport, which can make their output for curvature tasks undesirable (as it messes with what is the mathematical tangent of a spline in favour of what humans would expect. When you are at a loss about what I am talking about, search the forum for parallel transport and my username, the topic has come up multiple times in the past). It might be better to get the LineObject of a spline, i.e., its current discrete form, and do all the math based on its vertices.
Aha ... thank you - this explains why I get so different from spline-helpers tangent and cross tangent. Could also corelate to my "noisy" sampling with splinehelper (see screen below)
My question other topic but same context would be how to get a more high resolution Line-Object. We talked about this in an early stage about this, but my code wasn't mature enough to be sure. -> Is the short answer C4D can not get more precise than a 0° degree line object ?Screenshot line object Bezier 0° degree (for enough resolution). Nice plot but resolution enough? Probably not for edge cases like flatish dips.
![2025-10-27-Cinema 4D 2025.2.1 - [Untitled 1 _] - Main_001065.png](/forum/assets/uploads/files/1761567924397-2025-10-27-cinema-4d-2025.2.1-untitled-1-_-main_001065.png)
![2025-10-27-Cinema 4D 2025.2.1 - [Untitled 1 _] - Main_001066.png](/forum/assets/uploads/files/1761567924411-2025-10-27-cinema-4d-2025.2.1-untitled-1-_-main_001066.png)
Splinehelper 200x samples not moving average smoothed. The noise starts to show at about double the resolution of a line object ...
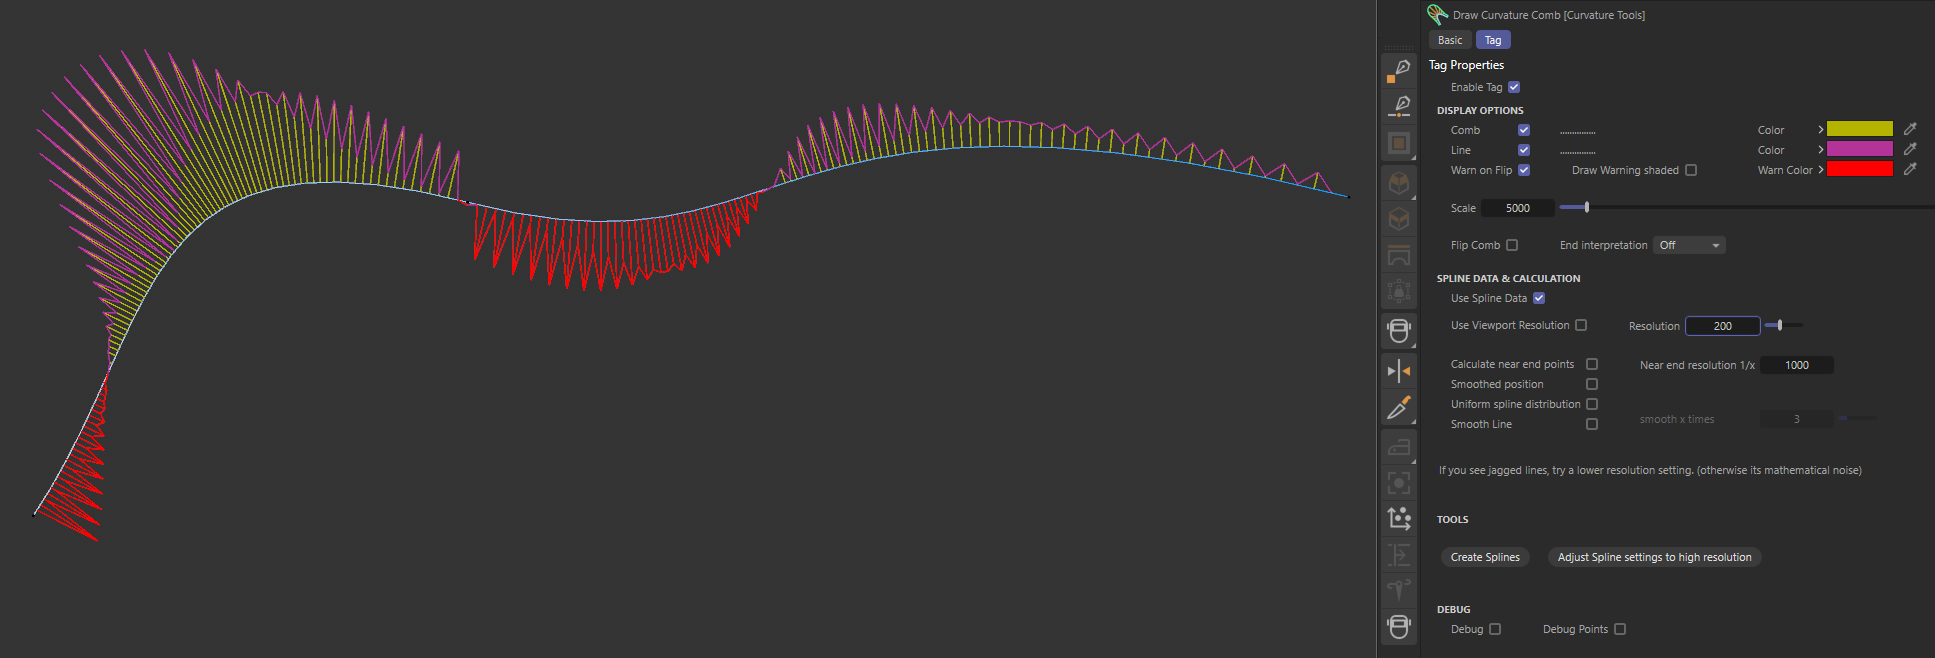
Should I open another Topic?
thank you again -
Usage of SplineHelp.InitSplineWith() regarding flags -> returned data
Dear community,
Returned Data of Flag
c4d.SPLINEHELPFLAGS_CONTINUECURVEunclear.I've read that the
SplineHelp()has flag calledc4d.SPLINEHELPFLAGS_CONTINUECURVE.
While the written explanation is clear to me :
Continue the curvature of an existing spline at the end points.Its unclear to me how to utilize the data or even how the data I get is different from a "normal" helper.
Reason of interest: I am coding a "Curvature" displaying Tag Plugin atm.
thank you for your time.
cheers mogh -
RE: Broken Push Notifications
Hm, interesting, It works now,
either you did something or the solution is to post a comment to trigger it. Anyway Thanks.
Cheers mogh -
RE: Broken Push Notifications
I still have the same problem. "No push" no "unread toppics". Clearing my Browser Chache does nothing.
any idea ?
cheers mogh