Hey @shir,
Thank you for reaching out to us. A Program Database (PDB) is a debug information format from Microsoft. It is comparable to the DWARF debug information format often used under Linux and macOS. However, unlike DWARF under Linux, where debug information is directly compiled into the binary, Microsoft chooses to store debug information in separate files, the pdb files.
When you attach a debugger to a binary without any debug information, it will by default only see the machine code of the binary. So when you have an issue and the debugger puts out a stack trace, it will only show you the offsets in a library, e.g., something like this:
#1 0x0000000000767576 in myBinary.dll
#2 0x0000000000767df4 in otherBinary.dll
#3 0x0000000000773aca in myBinary.dll
#4 0x00000000004b893e in myBinary.dll
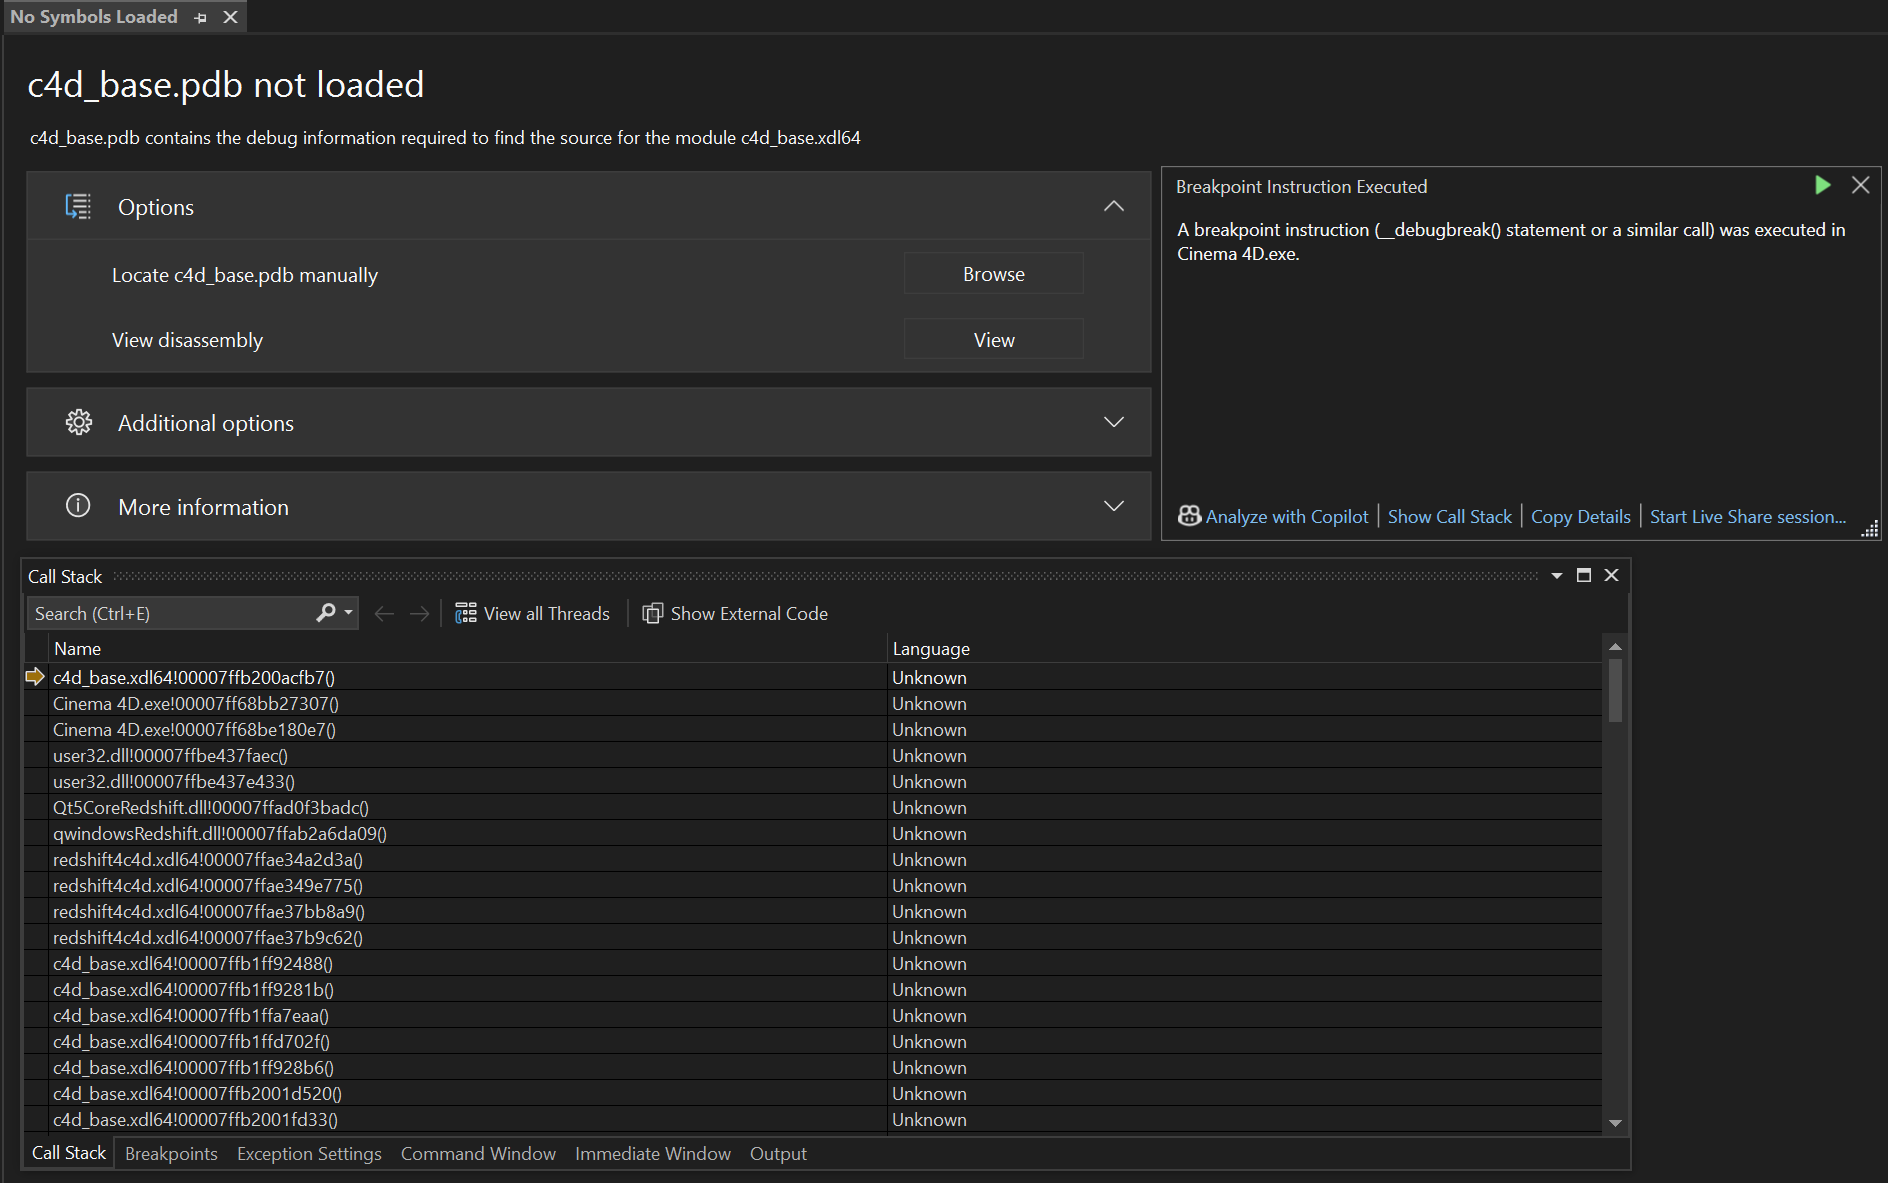
You can see this happen in the call stack window in your screenshot. VS only provides information in the format someBinary.ext!someAddress(), e.g., c4d_base.xdl64!00007ffb200acfb7(), as it has no further information. With bin!address() VS means a function at that address is being called. In my opinion, VS has one of the most cryptic stack trace formats out there and can be a bit confusing for beginners.
To see meaningful output, you need the debug information for that binary, which among other things contains the mapping of addresses to source code. If you have the pdb file for the binary, you can load it into your debugger, and it will then show you something like this instead:
#1 0x0000000000767576 in MyClass::MyMethod() at myClass.cpp:42
#2 0x0000000000767df4 in OtherClass::OtherMethod() at otherClass.cpp:15
#3 0x0000000000773aca in MyClass::AnotherMethod() at myClass.cpp:78
#4 0x00000000004b893e in main() at main.cpp:10
When you compile the Cinema 4D SDK and your source code, it will automatically generate the pdb files for these binaries for you, so that you can debug them in a meaningful manner. But what we see here is Visual Studio asking you for the pdb for c4d_base.xdl64, one of the core library binaries located in the corelibs folder of the Cinema 4D application you are debugging with. You did not compile that binary, so you do not have the pdb file for it. And we do not ship our binaries with debug information, as that would not only be a very large download, but also would expose our source code to the public.
You are hitting a debug stop there (VS tells you that in the info box by stating this is a __debugbreak). This is the less critical case of a debug event, which is covered by the very tutorial you are following (the other one being a critical stop). You can simply hit continue in your debugger and ignore this. The event seems to be raised from Redshift, judging by the stack trace we can see in the screenshot you provided. There is probably some minor hardware issue or so, and Redshift is trying to handle it gracefully by raising this debug event.
It is, however, not normal when this happens permanently and usually it hints at a corrupted installation of Cinema 4D or a hardware issue when you are always greeted by debug events on startup (or even when just running and interacting with Cinema 4D). Sometimes debug stops can happen as a one-time thing when you are debugging for the first time against some Cinema 4D instance (and it has not yet built all its prefs, caches, and other things Cinema 4D builds in the background). When this persists and you are annoyed by having to press continue, I would recommend trying to either remove Redshift from your Cinema 4D installation or reinstall Cinema 4D altogether.
You could also check inside of Cinema 4D if you can see any errors in the 'Redshift Feedback Display' window. For you as a third party, it is however not possible to find out what that issue in c4d_base.xdl64 at the offset 7ffb200acfb7 is.
Cheers,
Ferdinand
PS: There is also g_enableDebugBreak=true|false which you can pass to your Cinema 4D instance as a commandline argument. With that you can permanently mute debug stops. But that is more of an expert feature and you probably do not want to enable that as a beginner.