How to measure Viewport performance? -> Troubleshooting and optimization.
-
Dear community,
It would be really nice if there was a SDK way to measure viewport performance. ( I guess profiling wont suffice) - Something like a plugin to measure viewport performance or something that logs frames, frames consistency, from the C4D internals.
C++ plugins are out of my expertise, and I suspect an "external" plugin wont have the access to all the measurements needed.For plugin developers this could be useful I guess.
Where is the question ? I don't know this is probably a desperate cry for help.
Reason: I am having lag and freezes (empty scene) since S26 onwards (vague guess) and I can not get rid of them, even after several support sessions with Maxon and internal IT.
Thank you for your condolence.
mogh -
Hey @mogh,
Thank you for your question. Although development related, I would more put this into the domain of end user support (thank you for posting in the correct forum).
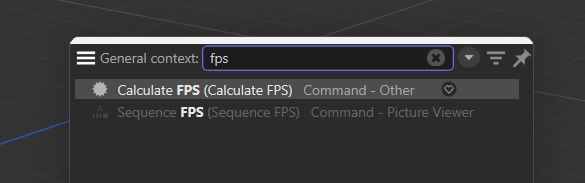
I would point out that Cinema 4D already has a tool to measure FPS ('Calculate FPS') but when you were in contact with end user support, I guess they already mentioned it and you concluded that it is not enough.
Internally, we developers use either this tool or a full on dedicated profiler (something like superluminal or VTune) but you need the source code or at least the symbols of Cinema 4D for that to make any sense. For Python I added mxutils.TIMEIT a while ago, but that is limited to profiling function calls and is also generally limited as any profiling that you just do 'from within' your source code.
Cheers,
Ferdinand -
Thank you ferdinand.
I did not know about the "new" FPS helper, -> there is a checkbox "Save Profile Summary" -> where is that stored and how can I review it ?What do all the options do exactly, is there a short explanation somewhere ? I could not find anything in the C4D Help.
thanks
-
Hey,
The opposite is true, Calculate Fps and the systems below it are very old. This is a developer tool, so you could say it naturally is not documented
") . Here is a rough explanation:
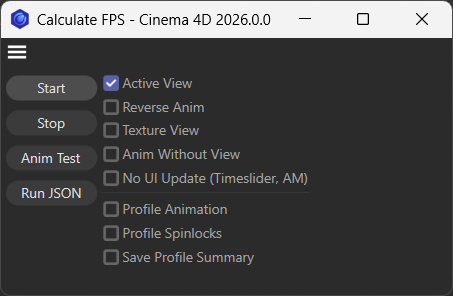
. Here is a rough explanation:- Start/Stop: Runs a procedural camera animation of the scene. I think mostly the viewport team uses it. Just outputs FPS and a timing.
- Anim Test: The actual tool, this just runs your active document.
- Run JSON: I have no idea, never used it.
- Active View: No idea, I think its is broken. You have always to enable it.
- Reverse: If to play the scene in reverse.
- Texture View: Never used it, no idea.
- Without View: Disable viewport redraws while profiling.
- Without UI: Disable UI redraws while profiling.
- Profile Animation/Spinlocks/Save Profile Summary: They all concern animation tests and what is put into the report.
The summary will automatically be opened once the animation test finished (you must have an app associated with
txtfiles but it is almost impossible to not have at least one app associated with that file format). The data in a report is fairly technical and likely not that useful for normal users. The main public purpose of the tool is to provide accurate FPS numbers in the dialog itself. There are also command line arguments with with you can run animation tests automatically, but they are just as most command line arguments for Cinema 4D not public as they are intended to be developer tools only.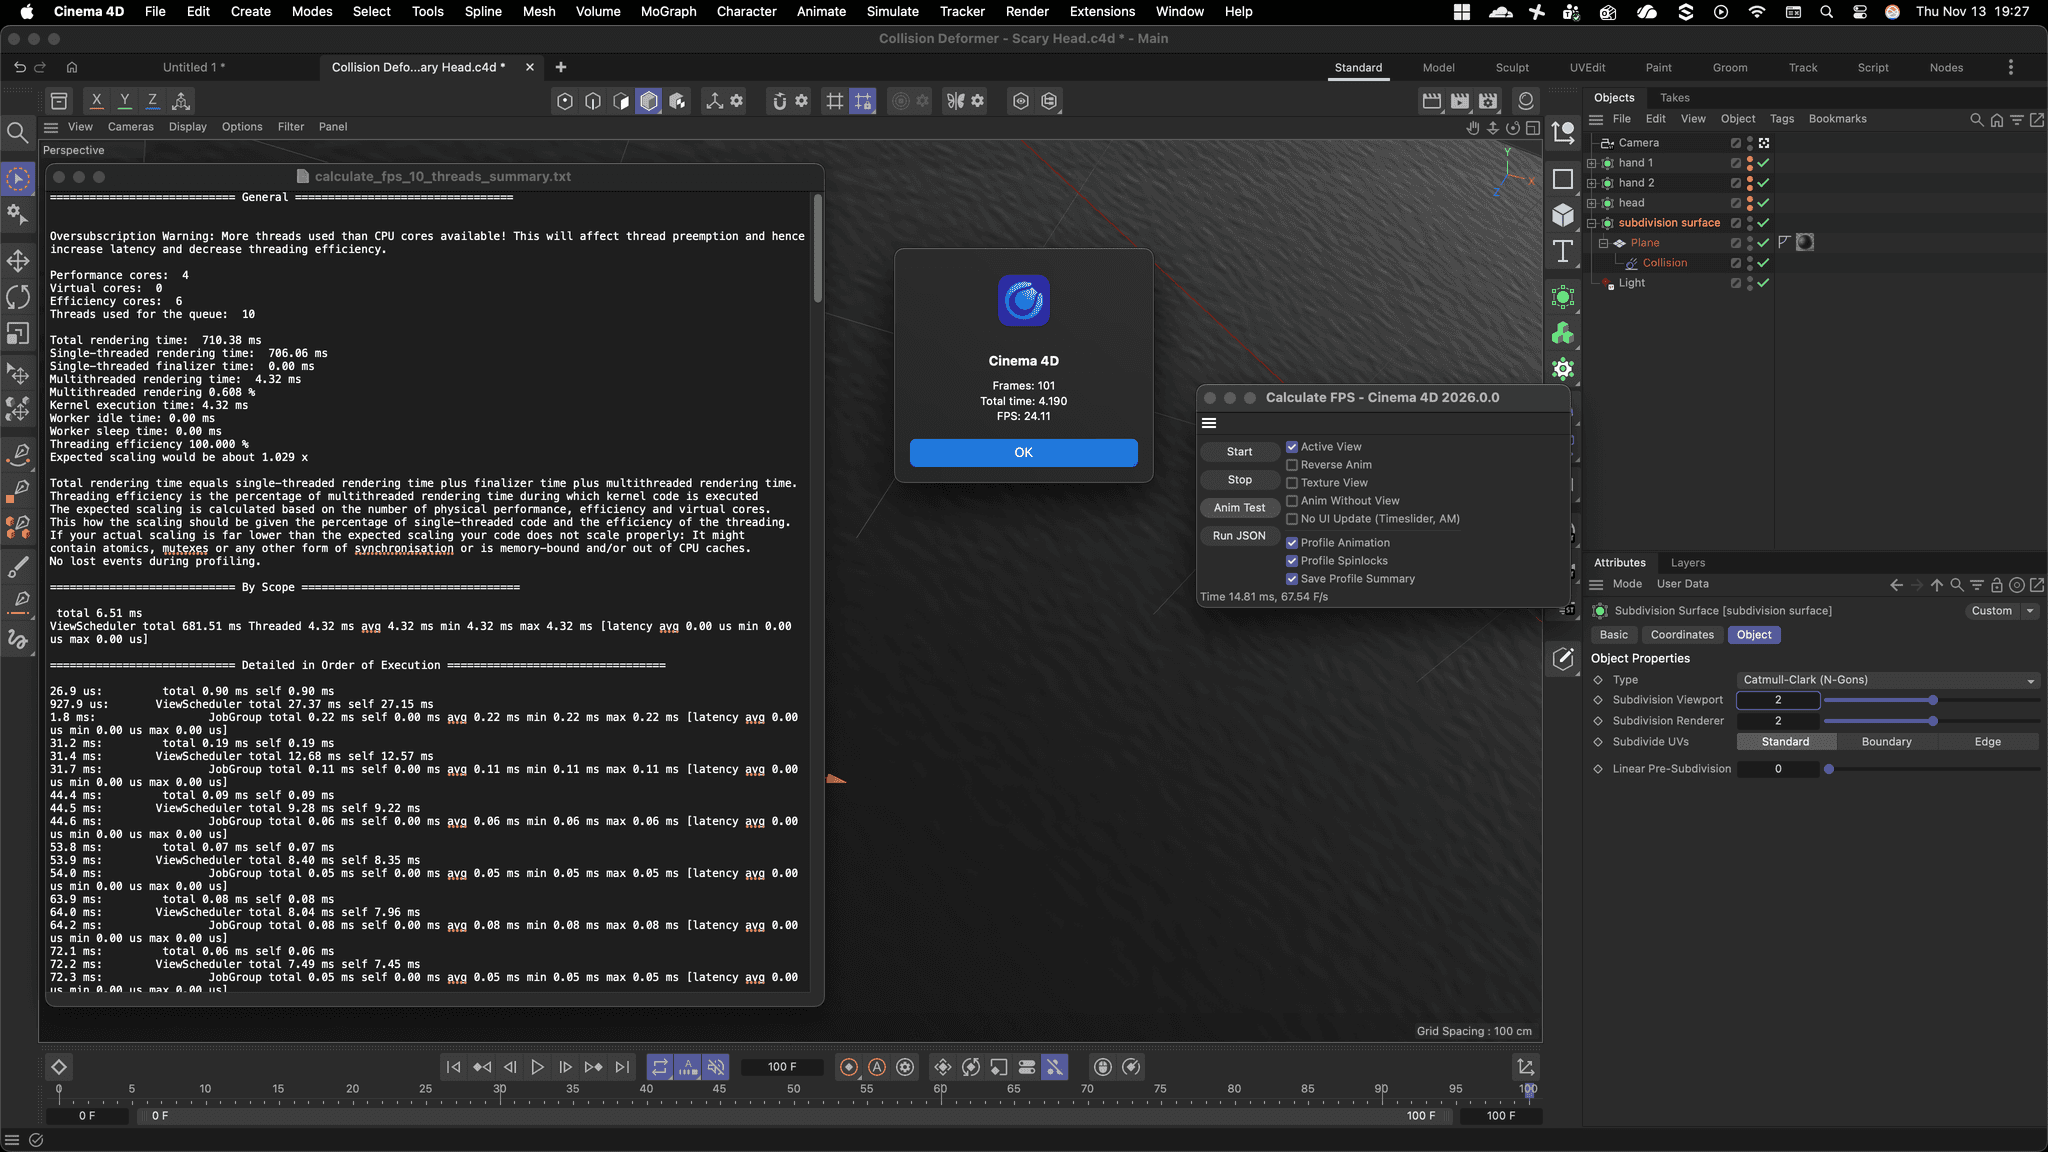
Cheers,
Ferdinand -
Thanks Ferdinand,
the Summary only pops on "Anim Test"
Empty Scene:
my old laptop has as a live readout (~ 5ms, at 60 FPS )
my Workstation has as a live readout (~ 33ms 52 FPS )compared to yours, mine seems off - while this will not help me immediate it keeps me sane ( I was starting to doubt myself if I really have a lag or problem ...)
thank you
Live readout 17ms, 59 FPS
Workstation: RTX 3090, i9-10980XE
empty scene
 ============================ General =================================

Performance cores:  36
Virtual cores:  18
Efficiency cores:  0
Threads used for the queue:  36

Total rendering time:  1744.82 ms
Single-threaded rendering time:  1711.42 ms
Single-threaded finalizer time:  0.00 ms
Multithreaded rendering time:  33.40 ms
Multithreaded rendering 1.914 %
Kernel execution time: 31.02 ms
Worker idle time: 0.00 ms
Worker sleep time: 0.00 ms
Threading efficiency 92.887 %
Expected scaling would be about 1.365 x

Total rendering time equals single-threaded rendering time plus finalizer time plus multithreaded rendering time.
Threading efficiency is the percentage of multithreaded rendering time during which kernel code is executed
The expected scaling is calculated based on the number of physical performance, efficiency and virtual cores.
This how the scaling should be given the percentage of single-threaded code and the efficiency of the threading.
If your actual scaling is far lower than the expected scaling your code does not scale properly: It might
contain atomics, mutexes or any other form of synchronisation or is memory-bound and/or out of CPU caches.
No lost events during profiling.

============================ By Scope =================================

 total 1.07 ms
ViewScheduler total 1411.58 ms Threaded 33.40 ms avg 31.02 ms min 31.02 ms max 31.02 ms [latency avg 0.00 us min 0.00 us max 0.00 us]

============================ Detailed in Order of Execution =================================

86.7 us: 	 total 1.07 ms self 1.07 ms
1.2 ms: 	ViewScheduler total 62.02 ms self 61.56 ms
2.7 ms: 		JobGroup total 0.46 ms self 0.03 ms avg 0.43 ms min 0.43 ms max 0.43 ms [latency avg 0.00 us min 0.00 us max 0.00 us]
... truncated
Live readout 97ms, 11 FPS Workstation: RTX 3090, i9-10980XE vehicle with 10.000 objects 119mio polys ~ 10% displayed ============================ General ================================= Performance cores: 36 Virtual cores: 18 Efficiency cores: 0 Threads used for the queue: 36 Total rendering time: 7433.32 ms Single-threaded rendering time: 5642.04 ms Single-threaded finalizer time: 0.00 ms Multithreaded rendering time: 1791.29 ms Multithreaded rendering 24.098 % Kernel execution time: 1788.86 ms Worker idle time: 0.00 ms Worker sleep time: 0.00 ms Threading efficiency 99.864 % Expected scaling would be about 5.957 x Total rendering time equals single-threaded rendering time plus finalizer time plus multithreaded rendering time. Threading efficiency is the percentage of multithreaded rendering time during which kernel code is executed The expected scaling is calculated based on the number of physical performance, efficiency and virtual cores. This how the scaling should be given the percentage of single-threaded code and the efficiency of the threading. If your actual scaling is far lower than the expected scaling your code does not scale properly: It might contain atomics, mutexes or any other form of synchronisation or is memory-bound and/or out of CPU caches. No lost events during profiling. ============================ By Scope ================================= total 6.35 ms ViewScheduler total 7001.25 ms Threaded 1791.29 ms avg 1788.86 ms min 1788.86 ms max 1788.86 ms [latency avg 0.00 us min 0.00 us max 0.00 us] ============================ Detailed in Order of Execution ================================= 63.5 us: total 6.35 ms self 6.35 ms 6.4 ms: ViewScheduler total 99.50 ms self 76.23 ms 10.6 ms: JobGroup total 0.08 ms self 0.00 ms avg 0.08 ms min 0.08 ms max 0.08 ms [latency avg 0.00 us min 0.00 us max 0.00 us] 10.7 ms: JobGroup total 0.17 ms self 0.00 ms avg 0.17 ms min 0.17 ms max 0.17 ms [latency avg 0.00 us min 0.00 us max 0.00 us] 11.0 ms: JobGroup total 0.04 ms self 0.00 ms avg 0.04 ms min 0.04 ms max 0.04 ms [latency avg 0.00 us min 0.00 us max 0.00 us] 11.0 ms: JobGroup total 0.35 ms self 0.00 ms avg 0.35 ms min 0.35 ms max 0.35 ms [latency avg 0.00 us min 0.00 us max 0.00 us] 11.4 ms: JobGroup total 0.13 ms self 0.00 ms avg 0.13 ms min 0.13 ms max 0.13 ms [latency avg 0.00 us min 0.00 us max 0.00 us] 11.6 ms: JobGroup total 0.37 ms self 0.00 ms avg 0.37 ms min 0.37 ms max 0.37 ms [latency avg 0.00 us min 0.00 us max 0.00 us] 12.0 ms: JobGroup total 0.14 ms self 0.00 ms avg 0.14 ms min 0.14 ms max 0.14 ms [latency avg 0.00 us min 0.00 us max 0.00 us] 48.1 ms: JobGroup total 21.98 ms self 0.03 ms avg 21.95 ms min 21.95 ms max 21.95 ms [latency avg 0.00 us min 0.00 us max 0.00 us] 112.9 ms: ViewScheduler total 138.31 ms self 116.85 ms truncatedheavy scene camera orbit animation ============================ General ================================= Performance cores: 36 Virtual cores: 18 Efficiency cores: 0 Threads used for the queue: 36 Total rendering time: 9071.78 ms Single-threaded rendering time: 7352.54 ms Single-threaded finalizer time: 0.00 ms Multithreaded rendering time: 1719.24 ms Multithreaded rendering 18.952 % Kernel execution time: 1698.41 ms Worker idle time: 0.49 ms Worker sleep time: 0.00 ms Threading efficiency 98.788 % Expected scaling would be about 4.854 x Total rendering time equals single-threaded rendering time plus finalizer time plus multithreaded rendering time. Threading efficiency is the percentage of multithreaded rendering time during which kernel code is executed The expected scaling is calculated based on the number of physical performance, efficiency and virtual cores. This how the scaling should be given the percentage of single-threaded code and the efficiency of the threading. If your actual scaling is far lower than the expected scaling your code does not scale properly: It might contain atomics, mutexes or any other form of synchronisation or is memory-bound and/or out of CPU caches. No lost events during profiling. ============================ By Scope ================================= total 5.63 ms ViewScheduler total 8711.70 ms Threaded 1719.24 ms avg 1698.41 ms min 1693.29 ms max 1703.53 ms [latency avg 11857.61 us min 11857.61 us max 11857.61 us] [sleep 0.00 us idle 493.53 us] ============================ Detailed in Order of Execution ================================= 61.5 us: total 5.63 ms self 5.63 ms 5.7 ms: ViewScheduler total 129.34 ms self 108.51 ms 9.5 ms: JobGroup total 0.07 ms self 0.00 ms avg 0.07 ms min 0.07 ms max 0.07 ms [latency avg 0.00 us min 0.00 us max 0.00 us] 9.6 ms: JobGroup total 0.19 ms self 0.00 ms avg 0.19 ms min 0.19 ms max 0.19 ms [latency avg 0.00 us min 0.00 us max 0.00 us] 9.8 ms: JobGroup total 0.03 ms self 0.00 ms avg 0.03 ms min 0.03 ms max 0.03 ms [latency avg 0.00 us min 0.00 us max 0.00 us] 9.9 ms: JobGroup total 0.34 ms self 0.00 ms avg 0.34 ms min 0.34 ms max 0.34 ms [latency avg 0.00 us min 0.00 us max 0.00 us] 10.3 ms: JobGroup total 0.10 ms self 0.00 ms avg 0.10 ms min 0.10 ms max 0.10 ms [latency avg 0.00 us min 0.00 us max 0.00 us] 10.4 ms: JobGroup total 0.08 ms self 0.00 ms avg 0.08 ms min 0.08 ms max 0.08 ms [latency avg 0.00 us min 0.00 us max 0.00 us] 10.6 ms: JobGroup total 0.07 ms self 0.00 ms avg 0.07 ms min 0.07 ms max 0.07 ms [latency avg 0.00 us min 0.00 us max 0.00 us] 42.9 ms: JobGroup total 19.49 ms self 0.03 ms avg 19.47 ms min 19.47 ms max 19.47 ms [latency avg 0.00 us min 0.00 us max 0.00 us]``` -
Hey @mogh,
I agree that the tool is not so greatly documented but I told you that the options at the bottom (i.e. also 'saving') all only concern animation tests
I guess your grievance is this one:
Live readout 97ms, 11 FPS; Workstation: RTX 3090, i9-10980XE? As far as I understand, you are dealing with this outside of any plugins you have developed? Which would make this an end user issue, I really cannot help you there.What you can do, is disable all drawing operations (Anim Without View, No Ui Update), to see how fast your scene is then. I.e., you then mostly only pay the price for Cinema 4D building the scene for each update event (caches, expressions, animations, etc.). Because it could very well be that you just created there a scene which is very inefficient or are using there plugins which are. So, the slow viewport is just an effect of scene evaluation being so expensive. Which is often the cause when scenes are slow or very slow.
edit: Okay, now I see it. 10,000 objects and 120 million polygons. Yeah, Cinema 4D won't like that. Just combine all objects into one, and your numbers should go up. What makes the scene likely slow, is the sheer number of objects. 12 million polygons (10% of 120 million) is something Cinema 4D can handle with such GPU. But it makes really a difference if all these polygons are in one object, or as in your case, scattered over 10,000 objects.
edit 2: okay, now I saw also your comment about the 'old' laptop compared to a (presumably new) workstation. I would not rule out that you have here multiple issues. That 10k + 12kk scene very likely performs not so great on many machines. In addition, you might have a defective GPU or outdated drivers. Did you update your drivers an ran a GPU stress test to ensure that your GPU pulls the numbers it should be able to pull? You could also use Cinebench.
Cheers,
Ferdinand -
Hi ferdinand,
Thank you for your time please do not prioritize this conversation, I feel bad for hijacking your time.Heavy Scene from above disable all drawing operations (Anim Without View, No Ui Update) looks fine i guess Total rendering time: 648.58 ms Single-threaded rendering time: 566.39 ms Single-threaded finalizer time: 0.00 ms Multithreaded rendering time: 82.19 ms Multithreaded rendering 12.673 % Kernel execution time: 82.19 ms Worker idle time: 0.00 ms Worker sleep time: 0.00 ms Threading efficiency 100.000 % Expected scaling would be about 3.611 xI am expressing myself not precise enough.
its not about the raw FPS I am worried about, 11 FPS on our vehicles is fine I guess. what keeps me up at night is these recurring stutters when moving the camera through the scene (no animation just looking at stuff)
and things like the time to see a simple cube in a empty scene - it always feels laggy or you could say delayed
or how the Live selection circle lags behind the mouse pointer (empty scene)oversimplified example:
Heavy scene FPS graph ( 0, 0, 0, 11, 11, 11, 11, 0, 0, 11, 11, 11, 11, 0, 0, 11, 11 )
Cube creation FPS graph ( 0, 0, 0, 60, 60, 60, 60, ... )Plugin related this is more or less what started this hunt .... :
I can interact with my Draw line Plugin (that is not the state of the plugin its evolved now but to give a exaple) on my:- laptop with ~60 FPS (Quadro 2000)
- on my private PC with R20 with ~200+ FPS (RTX 4080)
- on my workstation with ~8 FPS (RTX 3090)
yes crawlingly slow
the plugin performance depends on Viewport size and point number but the difference repeatable between these "test" machines.
(Cinebench 2024.1 - GPU Test 3090 ~ 17000 points 25Minutes continuous) Feels fine
cheers
-
Hey @mogh,
I forgot this thread a bit, sorry. That sounds all very mysterious. When I summarize your issue, I would describe it as follows. I assume that is the gist of it?
I have a workstation and experience there micro- and macro-stutters in the viewport performance. This happens primarily in low performing scenes with a heavy payload. The odd thing is though, that these performance dips only happen on one machine. On other comparable machines I have an an order of magnitude better performance.
This is very hard to debug, but I would say there are two main cases of what could be going wrong.
- Your GPU is damaged or you use corrupted drivers. Outdated drivers alone cannot explain the numbers you report. It could also be the mainboard, although somewhat unlikely.
- You have another VRAM intensive app running on this machine. Cinema 4D and this app then play the VRAM memory battle, causing data to be constantly cycled in and out of VRAM, causing the performance dips. But this is somewhat unlikely as you probably would be aware of this.
What I would do:
- Update all your drivers.
- Go into
Preferences/Viewport Hardwareand start dialing knobs to see if you can make a difference. Cinema 4D has unfortunately not a software viewport renderer anymore with which you could do a baseline test. - Use a GPU monitoring tool (like MSI Afterburner) to see if your GPU is running at full load, or if there are spikes in VRAM usage. There are also more fancy tools with which you can monitor memory allocations over time.
- Run GPU tests such as FurMark or 3DMark to see if your GPU behaves stable there.
- Install a different GPU (not fun to do, but the best way to rule out hardware issues).
There could also be a bug in Cinema 4D but with numbers as shown below that strikes me as a very unlikely cause. This sounds more like damaged hardware or a really nasty driver issue.
- laptop with ~60 FPS (Quadro 2000)
- on my workstation with ~8 FPS (RTX 3090)
Cheers,
Ferdinand