First R21 plugin ... memory leaks and dangling references
-
I am surprised as well to see these issue, as I figure I wouldn't be the only one if this were genuine memory leaks. I can only assume something went wrong during my setup of the SDK.
I have started afresh and have extracted the R21 SDK on my D drive at
D:\Projects\Dev\SDK_R21
There a subfolder named "frameworks" has been created with the content of the SDK.zipAlso inside D:\Projects\Dev\SDK_R21 I have a "plugins" folder, which only contains the extracted "cinema4dsdk" folder (I removed maxonsdk.module and microsdk), and a "project" folder, which contains the solution projectdefinition.txt as follows
Platform=Win64;OSX
Type=Solution
Solution=\
	plugins/cinema4dsdk
I downloaded the projecttool (20190903) and extracted this into
D:\Projects\Dev\SDK_R21, which created a "cinema4d_r21_project_tool_20190903" folder.In D:\Projects\Dev\SDK_R21 I created a bat file to execute the projecttool, as follows:
d:\Projects\dev\SDK_R21\cinema4d_r21_project_tool_20190903\kernel_app_64bit.exe g_updateproject=d:\Projects\dev\SDK_R21\plugins\projectI execute this batch file, which generates the plugins solution, which I double click, opening Visual Studio 2017.
I make cinema4dsdk the startup project, enter the Cinema4D executable into the project's debugging properties. Build all (debug, 64bit), start debugging, wait for Cinema 4D to launch, close cinema ... and get the list of memory leaks and dangling references.As I didn't add a specific plugin folder to the build project, nor did I manually install any plugin, I can confirm there are no plugins available in the Extension menu of Cinema4D.
Windows 10, 64 bit, Professional Edition (build 18362)
4(8)x Intel Core i5-8259U CPU, CPU speed 2310.000
Visual Studio Express 2017 for Windows Desktop Version 15.9.15
Microsoft .NET Framework 4.8.03752 -
OK, so I went over it once more.
Step 1.
Deleted the whole SDK_R21 folder, and extracted the sdk.zip to
D:\Projects\Dev\SDK_R21Step 2
Extracted the project toolStep 3
created and executed a batch file to create the necessary project files for the frameworksd:\Projects\dev\SDK_R21\cinema4d_r21_project_tool_20190903\kernel_app_64bit.exe g_updateproject=d:\Projects\dev\SDK_R21\frameworksStep4
created and executed a batch file for the pluginsd:\Projects\dev\SDK_R21\cinema4d_r21_project_tool_20190903\kernel_app_64bit.exe g_updateproject=d:\Projects\dev\SDK_R21\pluginsStep 5
created and executed a batch file for the plugin solutiond:\Projects\dev\SDK_R21\cinema4d_r21_project_tool_20190903\kernel_app_64bit.exe g_updateproject=d:\Projects\dev\SDK_R21\plugins\project(This batch file will be used when plugins are added, in order to update the plugins solution)
Step 6
Double click the created plugin.sln, which opens Visual Studio.Step 7
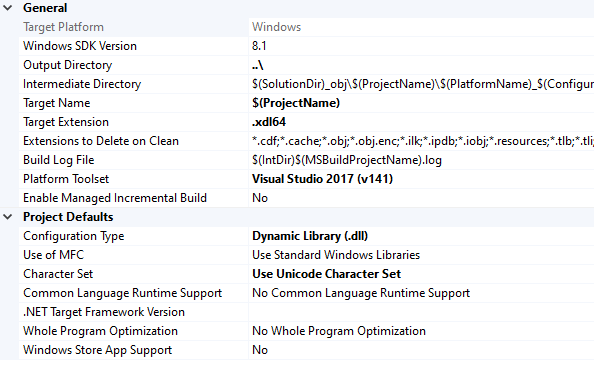
Build the whole solution, which results in errors for every vcxproj, as it mentions that Windows SDK version 8.1 was not found. Since running on Windows 10 I retarget all the projects ... Visual Studio offers the available Windows SDK 10.0.17763.0
I do this for every framework and plugin in the solution.Step 8
Rebuild whole solution -> no more build errors.Step 9
I set the cinema4dsdk as startup project, add the Cinema4D executables as debugging propertyStep 10
Launch debugger, wait for Cinema 4D to launch, open the console (Shift-F10), close Cinema 4D ...Result: ALL GOOD, no memory leaks, no dangling references.
Pffewh! Now I am finally settled, ready to start.I don't know what went wrong the first and second time, and I am not trying to figure out.
-
Spoke too soon !!!
The moment I add
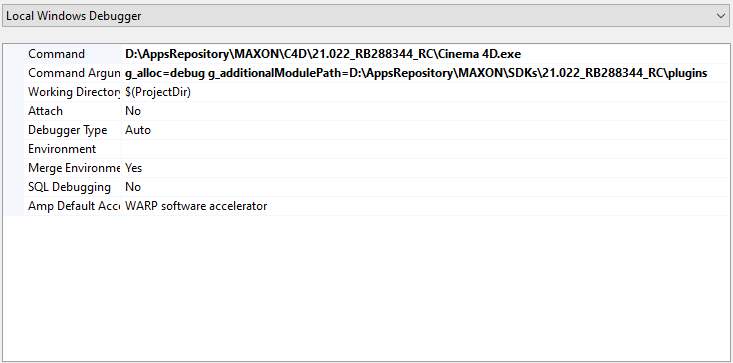
g_alloc=Debugas Command Arguments of the debugging properties to any of the plugins, I do get the same list of memory leaks and dangling references .I remember that entry from the time working on R20 and previous releases ... is this not applicable for R21 anymore?
Additionally, every plugin I add to the solution requires me to retarget from Windows 8.1 SDK to the Windows 10 SDK, since the R8.1 isn't installed. Is this 8.1 SDK reference a default of the project tool?
Since Cinema only runs on Windows 10, and plugins thus should be using Windows 10 SDK, why this obsolete 8.1 ? -
Hi Daniel,
thanks for the throughful description, but I'm not able to reproduce the leak.
The steps I used are:
- unzip the sdk.zip coming with Cinema 4D R21 installation (let say in
D:\AppsRepository\MAXON\SDKs\21.022_RB288344_RC) - unzip the projecttool (lets say in
D:\AppsRepository\MAXON\ProjectTool\20190903_R21RC_projecttool) - execute
D:\AppsRepository\MAXON\ProjectTool\20190903_R21RC_projecttool\kernel_app_64bit.exe g_updateproject=D:\AppsRepository\MAXON\SDKs\21.022_RB288344_RC(this single string will create projects for frameworks, plugins and the whole solution file, it's not recommended to run it three separate times) - open the solution with VS2017 and just build (I actually didn't changed the Windows SDK Version)

- set the proper cmdline args as from below picture

- Press F5 in VS2017 to start debug
- Upon Cinema start, open the Console (Shift-F10)
- Quit Cinema
I didn't had the need to change anything in the solution settings, everything was built out-of-the-box as much as it's supposed to happen.
Could you please try to reproduce the issue with the steps above?Thanks, Riccardo
- unzip the sdk.zip coming with Cinema 4D R21 installation (let say in
-
Hi Riccardo,
I had installed Visual Studio 2017 Desktop Express, and wasn't able to add the Windows 8.1 SDK during installation due to limited settings being available. So, I uninstalled that one, and instead downloaded the Visual Studio 2017 Community Edition.
Reinstalled all, making sure the Windows 8.1 SDK option was enabled.
Removed the whole SDK folder and extracted once more, completely afresh. Same for the project tool.
I then launched the project tool with the command as you listed (once). Double clicked the solution, and built everything. Now with the Windows 8.1 SDK present I didn't have to retarget every project ... nice!However, when pressingn F5:
Without the "g_alloc=debug" in the debugging options all runs fine, and after quiting Cinema4D no issues are listed. But, when I add the debugging option I still get the same list of memory leaks and dangling references.Unfortunately, no progress.
-
Hi Daniel,
I've created your same setup in a Virtual Window 10 environment and I had no good luck in replicating this.
Can you share your GPU specs and drivers revision information? With this info I can have a look around to see if any of our QA or developers have experienced something similar.Best, Riccardo
-
Here's a dump from DxDiag:
------------------
System Information
------------------
      Time of this report: 9/19/2019, 21:45:45
             Machine name: NUC
         Operating System: Windows 10 Pro 64-bit (10.0, Build 18362) (18362.19h1_release.190318-1202)
                 Language: English (Regional Setting: English)
      System Manufacturer: Intel(R) Client Systems
             System Model: NUC8i5BEH
                     BIOS: BECFL357.86A.0064.2019.0213.1122 (type: UEFI)
                Processor: Intel(R) Core(TM) i5-8259U CPU @ 2.30GHz (8 CPUs), ~2.3GHz
                   Memory: 32768MB RAM
      Available OS Memory: 32636MB RAM
                Page File: 2894MB used, 34606MB available
              Windows Dir: C:\Windows
          DirectX Version: DirectX 12
      DX Setup Parameters: Not found
         User DPI Setting: 96 DPI (100 percent)
       System DPI Setting: 96 DPI (100 percent)
          DWM DPI Scaling: Disabled
                 Miracast: Available, with HDCP
Microsoft Graphics Hybrid: Not Supported
 DirectX Database Version: Unknown
           DxDiag Version: 10.00.18362.0267 64bit Unicode

---------------
Display Devices
---------------
           Card name: Intel(R) Iris(R) Plus Graphics 655
        Manufacturer: Intel Corporation
           Chip type: Intel(R) Iris(R) Plus Graphics Family
            DAC type: Internal
         Device Type: Full Device (POST)
          Device Key: Enum\PCI\VEN_8086&DEV_3EA5&SUBSYS_20748086&REV_01
       Device Status: 0180200A [DN_DRIVER_LOADED|DN_STARTED|DN_DISABLEABLE|DN_NT_ENUMERATOR|DN_NT_DRIVER]
 Device Problem Code: No Problem
 Driver Problem Code: Unknown
      Display Memory: 16446 MB
    Dedicated Memory: 128 MB
       Shared Memory: 16318 MB
        Current Mode: 1920 x 1200 (32 bit) (59Hz)
         HDR Support: Not Supported
    Display Topology: Internal
 Display Color Space: DXGI_COLOR_SPACE_RGB_FULL_G22_NONE_P709
     Color Primaries: Red(0.673828,0.319336), Green(0.187500,0.706055), Blue(0.148438,0.064453), White Point(0.313477,0.329102)
   Display Luminance: Min Luminance = 0.500000, Max Luminance = 270.000000, MaxFullFrameLuminance = 270.000000
        Monitor Name: Generic PnP Monitor
       Monitor Model: DELL 2408WFP
          Monitor Id: DELA02C
         Native Mode: 1920 x 1200(p) (59.950Hz)
         Output Type: HDMI
Monitor Capabilities: HDR Not Supported
Display Pixel Format: DISPLAYCONFIG_PIXELFORMAT_32BPP
      Advanced Color: Not Supported
         Driver Name: C:\Windows\System32\DriverStore\FileRepository\iigd_dch.inf_amd64_bf9afe57cbde0e11\igdumdim64.dll,C:\Windows\System32\DriverStore\FileRepository\iigd_dch.inf_amd64_bf9afe57cbde0e11\igd10iumd64.dll,C:\Windows\System32\DriverStore\FileRepository\iigd_dch.inf_amd64_bf9afe57cbde0e11\igd10iumd64.dll,C:\Windows\System32\DriverStore\FileRepository\iigd_dch.inf_amd64_bf9afe57cbde0e11\igd12umd64.dll
 Driver File Version: 26.20.0100.6912 (English)
      Driver Version: 26.20.100.6912
         DDI Version: 12
      Feature Levels: 12_1,12_0,11_1,11_0,10_1,10_0,9_3,9_2,9_1
        Driver Model: WDDM 2.6
 Graphics Preemption: Triangle
  Compute Preemption: Thread
            Miracast: Supported
      Detachable GPU: No
 Hybrid Graphics GPU: Integrated
      Power P-states: Not Supported
      Virtualization: Paravirtualization
          Block List: No Blocks
  Catalog Attributes: Universal:False Declarative:True
   Driver Attributes: Final Retail
    Driver Date/Size: 28/05/2019 02:00:00, 1887728 bytes
         WHQL Logo`d: n/a
     WHQL Date Stamp: n/a
   Device Identifier: {D7B78E66-7DE5-11CF-36F8-1000BAC2D735}
           Vendor ID: 0x8086
           Device ID: 0x3EA5
           SubSys ID: 0x20748086
         Revision ID: 0x0001
  Driver Strong Name: oem4.inf:5f63e5341264f0f6:iCFL_w10_DS:26.20.100.6912:PCI\VEN_8086&DEV_3EA5
Extra note:
I now only have the included plugin projects in the solution, and usecinem4dsdkas startup project. No other plugins of mine are part of the solution.This whole issue reminds me about this:
https://developers.maxon.net/forum/topic/11212/memory-leak-after-plugin-migration-r16-r20
Same situation, memory leaks not reproducible. -
Warning: long and endless background drivel ahead ...
As mentioned before until R21 I was developing plugins on a laptop running Windows 8.1 and VS2015.
This laptop has an integrated nVidia Geforce 920m, next to the onboard Intel Graphics.
In the past I had upgraded to Windows 10 but didn't find acceptable stable video drivers and had to revert back after numerous crashes of the OS.
So, I kept using Windows 8.1. Which is the reason I couldn't install R21 and start developing. I thus purchased a new machine, and kept it simple: an Intel NUC having an 8th generation i5 CPU with integrated Intel Iris Plus Graphics 655. No dedicated graphics card, as I didn't plan on using this machine for 3D content creation, only for development purposes, and other less graphic related chores.On the "old laptop" I kept developing for R20, and ported the code to R21 on "the NUC".
Due to some eID install mishap on the laptop I lost my dedicated graphics car and needed to figure out how to resolve this. In the meantime I reverted to using the integrated intel graphics for further development. It is at this point in time I discovered that on this trusty and rusty laptop I also started to experience the memory leaks I encountered on the NUC.
I was finally able to resolve the nVidia graphics issue and regained access to the dedicated graphics card (food for another story, I am sure).
Surpisingly, as soon as I was using the nVidia again I didn't encounter any memory leaks ... without any changes, except for activating the nVidia in the laptops' BIOS.Now, I cannot try and do the same on the NUC, since it cannot accept any additional hardware (except eGPU ... which I am "budgetly" not enabled to access). I expect the same would be true for that machine. As soon as it would have a dedicated GPU it would be freed from all these memory leaks.
Question is now if these are actual memory leaks, or if these are "fake" reports from Visual Studio?Anyway, the issue I had seems to be resolved.
I am not changing the status of this topic to "SOLVED" as I feel the issue isn't exactly solved.
For anyone running a system without dedicated GPU the issue will probably still be an issue.I now understand why all you guys couldn't reproduce the issue in the first place. You probably have all kick-ass systems running heavy duty graphic cards.
-
Thanks Daniel for the extensive following up.
I'll check with our QA if there's a machine without a discrete graphic card in our testing environment that could confirm your issue. At the same time I'll rise attention of our viewport engineers on the topic.
Best, R.
-
Hi Daniel,
I just wanted to inform you that QA has been able to reproduce the issue. I've filed a bug report (ITEM#306240) and hope this to get solved soon.
Cheers, R
-
@r_gigante
Thanks for the feedback.FYI, this wasn't only with R21, had the same issue with R20, since the "old laptop" was restricted to R20 only. But I guess no updates will follow for R20 anymore.