Visual Studio Code Integration Manual
Learn how write and debug Python scripts and plugins in Cinema 4D using the Visual Studio Code (VS Code) editor by using the Cinema 4D Connector application bridge.
Table of Contents
Overview
The Cinema 4D Connector application bridge allows users to bind a VS Code instance to a Cinema 4D instance. From inside VS Code, users then can execute, debug, and test their scripts inside Cinema 4D. The extension also offers convenance features such as (better) syntax highlighting for py, res, and str files and templates for common script types.
Note
This manual describes binding the Cinema 4D app itself to VS Code. To run the interactive standalone Python interpreter c4dpy shipped alongside Cinema 4D in VS Code, see the c4dpy Manual.
Since Cinema 4D 2024.2, the Python interpreter shipped with Cinema 4D is optimized for being bound to VS Code.
Limitation
Autocompletion does not work for unsaved scripts coming from Cinema 4D.
Autocompletion does not work for the maxon package.
Debugging does not support elements of a scene embedding a Python script like the Python scripting tag, or the Python generator.
Installation
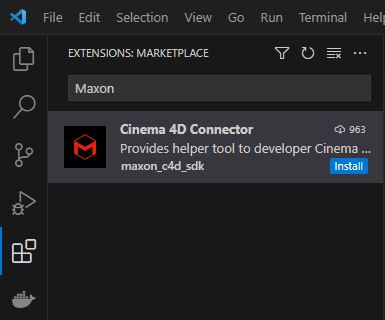
The Visual Studio Code Extension called Cinema 4D Connector can be installed by searching for maxon within the Extension panel of VS Code and then clicking Install on the extension called Cinema 4D Connector.
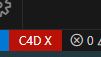
Once the extension has been installed successfully, a red button with the content C4D X will show up in the status bar of VS Code, signaling that VS Code is ready to be bound to a Cinema 4D instance.
Basic Usage
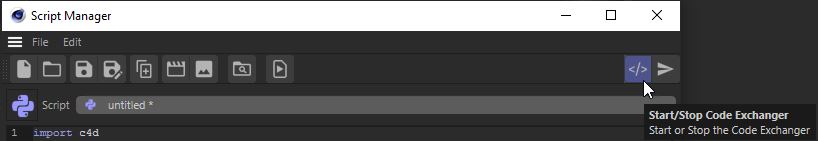
To start using the extension, open your daily-used Cinema 4D, access the Script Manager, and press the Start/Stop Code Exchanger button in the top right corner of its layout. This will start to establish a connection between this Cinema 4D and VS Code to allow for auto-completion and sending script and debugging data.
After starting the service in Cinema 4D, open VS Code or switch to an already opened VS Code instance and click the red “C4D X” red button in its status bar. This will finalize the connection and tie the broadcasting Cinema 4D instance to this VS code instance. Doing this, will also update the auto-completion environment of this VS Code instance to the API version of the connected Cinema 4D instance.

Once you have pressed the button, it should turn grey as shown above, and VS Code and Cinema 4D are now bound. The most important commands which are now available are (open the VS Code palette in the top menu from View/Command Palette and type c4d to see them all):
C4D: Execute in Cinema 4D as a Script in Script Manager: Attempts to run the currently active file as a Script Manager script in Cinema 4D. The file must have been saved at least once before, and the output and errors of the script will be also be displayed in the VS Code console.
C4D: Debug in Cinema 4D as a Script in Script Manager : Attempts to run the currently active file as a Script Manager script with a debugger attached, allowing you to set breakpoints and step through code. See the debugging sections below for details.
C4D: Load Script in Script Manager: Sends the currently active file in VS Code to the Script Manager of Cinema 4D. Doing this is usually not necessary, as a file send from Cinema 4D to VS Code will be automatically synchronized between both editors.
C4D: Load Cinema 4D Script Template: Provides a selection of predefined scripting element templates such as the Python Generator object.
C4D: Toggle Connection with Cinema 4D: WIll toggle the connection with a broadcasting Cinema 4D instance. Identical in functionality to the button in the task bar of VS Code.
Debugging Script Manager Scripts
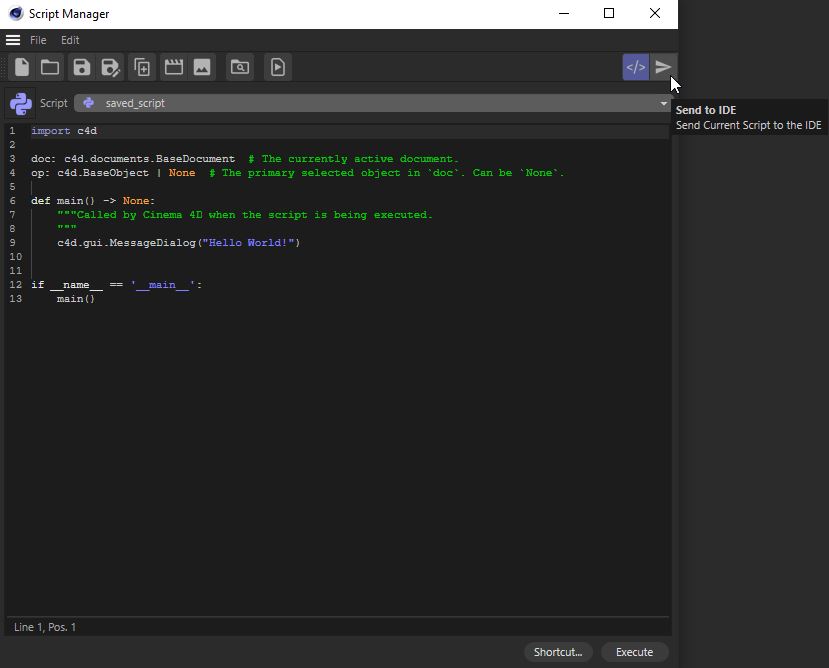
Visual Studio Code only supports debugging when a workspace is defined, for more information about the topic read Visual Studio Code - Debugging User Guide. Debugging is also only possible for saved files loaded by the Script Manager. First, ensure the code exchange has been started in the Script Manager and that the VS Code has been connected. Then send a saved script from Cinema 4D to Visual Studio Code by clicking the Send to IDE button in the Script Manager.
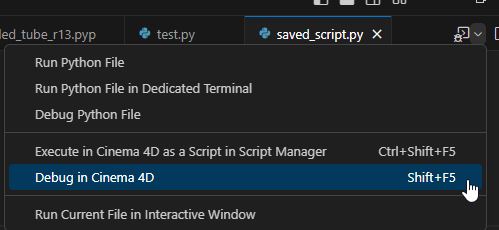
In the top menu of VS Code, then click on the execute icon dropdown and select Debug in Cinema 4D.
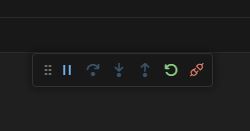
Now wait a few seconds, VS Code should connect to Cinema 4D and the debugging toolbar should open. Whenever the debugging toolbar is visible, you can place breakpoint in your code and they will be triggered each time your script is executed.
When you instead encounter the error message shown below,
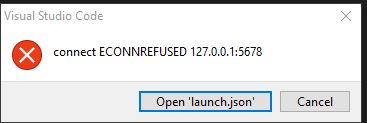
you must click on Open launch.json and replace everything in that file with the content shown below and then save launch.json.
{
    "version": "0.2.0",
    "configurations": [
        {
            "name": "Python attached to Cinema 4D - TCP: localhost:5678",
            "type": "python",
            "request": "attach",
            "connect": {
                "host": "localhost",
                "port": 5678
            },
        }
    ]
}
Once the changes have been saved, go to the debugging panel of Visual Studio Code, select the new configuration, and run it.
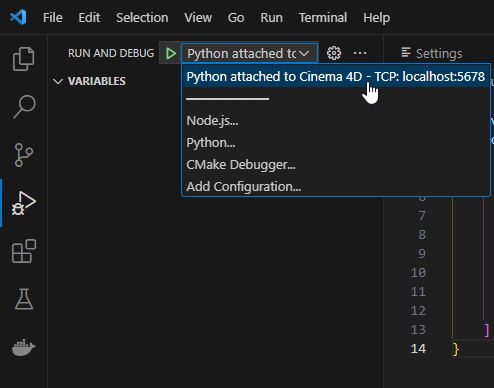
You should then be able to correctly connect to the debugger within Cinema 4D.
Debugging Plugins
Visual Studio Code only supports debugging when a workspace is defined, for more information about the topic read Visual Studio Code - Debugging User Guide. Debugging is also only possible for unencrypted Python plugin files. To debug a plugin, the debugger server must be started within Cinema 4D. This can be achieved by first debugging a script (as explained above) or by executing the script provided below in the Script Manager of Cinema 4D.
import debugpy
import sys

# Check that a debugger is not already running
if not (hasattr(sys, 'gettrace') and sys.gettrace() is not None):
    # Start the debugger server
    ip = "localhost"
    port = 5678
    debugpy.configure(python=debugpy.GetInternalPythonPath())
    debugpy.listen((ip, port))
    print(f"Debugger server started at {ip}:{port}")
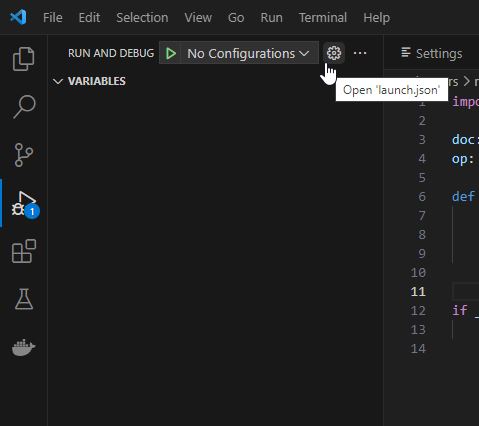
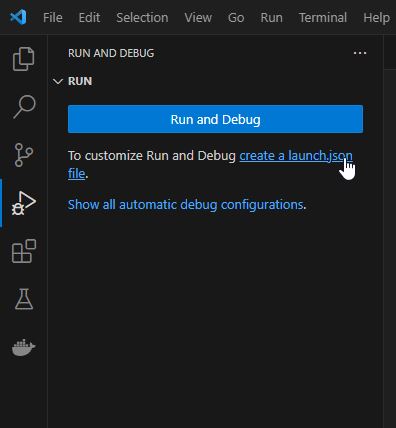
After the last line prints to the Python Console, navigate to Visual Studio Code. In the debugger panel, create a launch.json by clicking the cogwheel next to “No Configurations” or by selecting “create a launch.json file.”
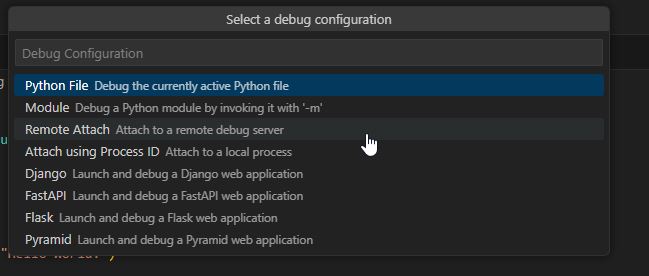
Then a popup window should be visible, select “Remote Attach”
A new popup displays the expected IP; keep ‘localhost’ and press Enter. For the default port use 5678 and press Enter again. Now replace the contents in launch.json with the data shown below:
{
    "version": "0.2.0",
    "configurations": [
        {
            "name": "Python attached to Cinema 4D - TCP: localhost:5678",
            "type": "python",
            "request": "attach",
            "connect": {
                "host": "localhost",
                "port": 5678
            },
        }
    ]
}
Once the changes have been saved, navigate to the debugging panel of VS Code, select the new configuration, and run it.
When running the configuration was successful and a connection has been made, you will see the debugging toolbar of VS Code, and can start debugging your plugin.
You can place breakpoints in your code and they will be triggered each time the plugin is executed. However, if you want to debug overiddable threaded methods such as ObjectData.GetVirtualObject(), you must insert the following code at the start of the to be debugged and threaded method, as the debugger will otherwise be unable to attach itself.
import debugpy
debugpy.trace_this_thread()